Oil Goes Negative
April 20, 2020, will forever go down as the day when the price of oil went negative. It has never happened before and with any luck it will never happen again. What should we make of it?
To start with, here is a screenshot of the action in “CL1” — the nearest futures contract in West Texas Intermediate crude, and “CL2,” for which delivery is a month further out. This shows that the action was very much concentrated in the nearest future, for which there was the most imminent risk that investors would find themselves required to take delivery of crude oil, even though there is now very little space in U.S. storage facilities and refineries to hold it. The movements in the nearest contract were quite extraordinary:

Can we safely ignore this as an extreme technical event that doesn’t really matter? No. The technicalities here involve not only the difficult mathematics of contango and backwardation in the financial derivatives market, but also the issues of managing fleets of tankers, oil pipelines, refineries and oil wells. Of course, oil cannot stay negative for very long. But difficult adjustments in the real world will need to be made — not just in portfolios.
Another obstacle to treating this as a technicality is the fact that nothing like it has happened before. My colleague Eddie De Walt published a chart of the oil/gold ratio early in the day, showing that at that point the oil price in gold terms had reached an unprecedented low:

Later in the day, the chart updated. An ounce of gold had earlier broken the barrier of being enough to buy 200 barrels of oil. An hour or two later, it would have bought you 3,500 barrels:

When I came to update Eddie’s chart, however, I discovered that things had changed a bit. At this point, one ounce of gold was enough to dispose of about 600 barrels. In other words, people would be prepared to take this amount of oil off your hands, but only if you gave them an ounce of gold first.

The scale on this chart goes back almost 40 years, to the initiation of these futures contracts. The absurdities such pricing implies for the entire financial system cannot be safely ignored.
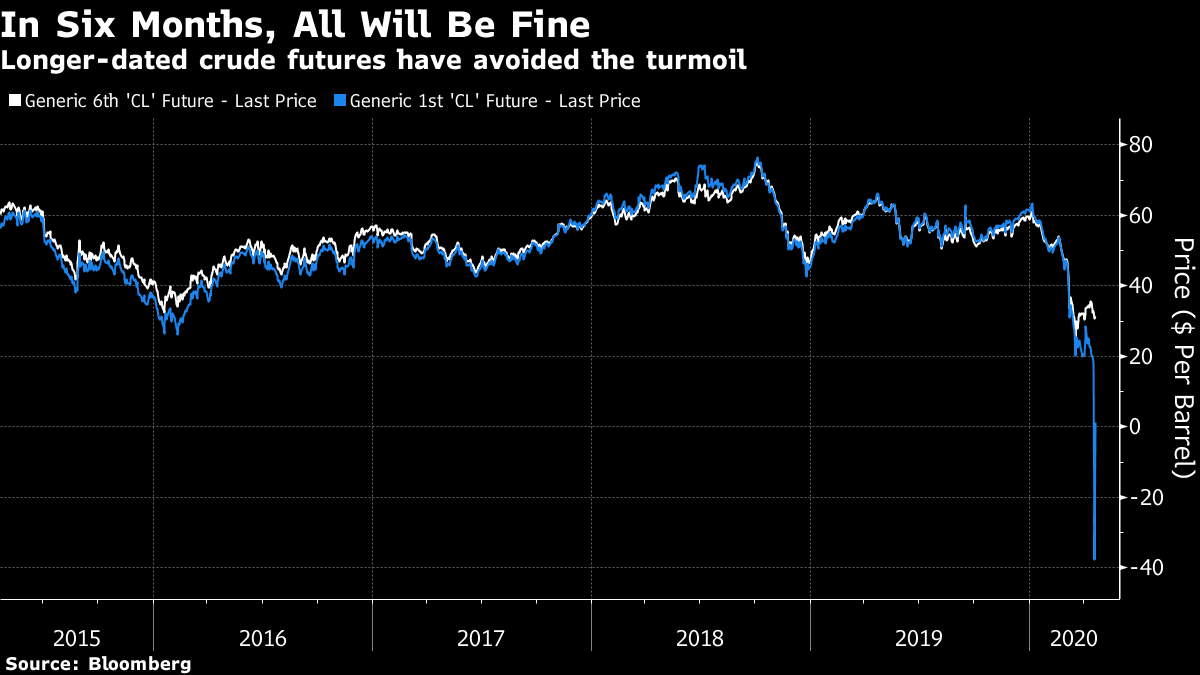
Do we have more horrors ahead? We might well, but the evidence is that they haven’t yet been priced in. Normally the futures for the first and sixth month trade in close alignment, as the following chart shows. They parted company a month ago. The odds are that the industry will be able to reorganize itself over the next few months to avoid the absurdity of needing to pay others to take oil in nonexistent storage. But getting to that point will be difficult.

Meanwhile, Monday’s events continue an important and marked pattern. The following chart gives a rough estimation of crude oil’s real price, taking into account U.S. inflation. The consumer price index itself includes gasoline, so this isn’t a perfect way to measure it. But notice that since August 1971, the month President Richard Nixon ended the dollar’s peg to gold under the Bretton Woods agreement, oil has at all times outstripped inflation. The chart is monthly, and ends with oil at its cheapest in real terms in two decades, and needing to fall 28% to drop below its pre-Bretton Woods level. At the current price ($1.84 per barrel at the time of writing), it has definitely got there. The evidence multiplies that the post-Bretton Woods order, anchored by oil and by independent central banks, is over and needs to be replaced:

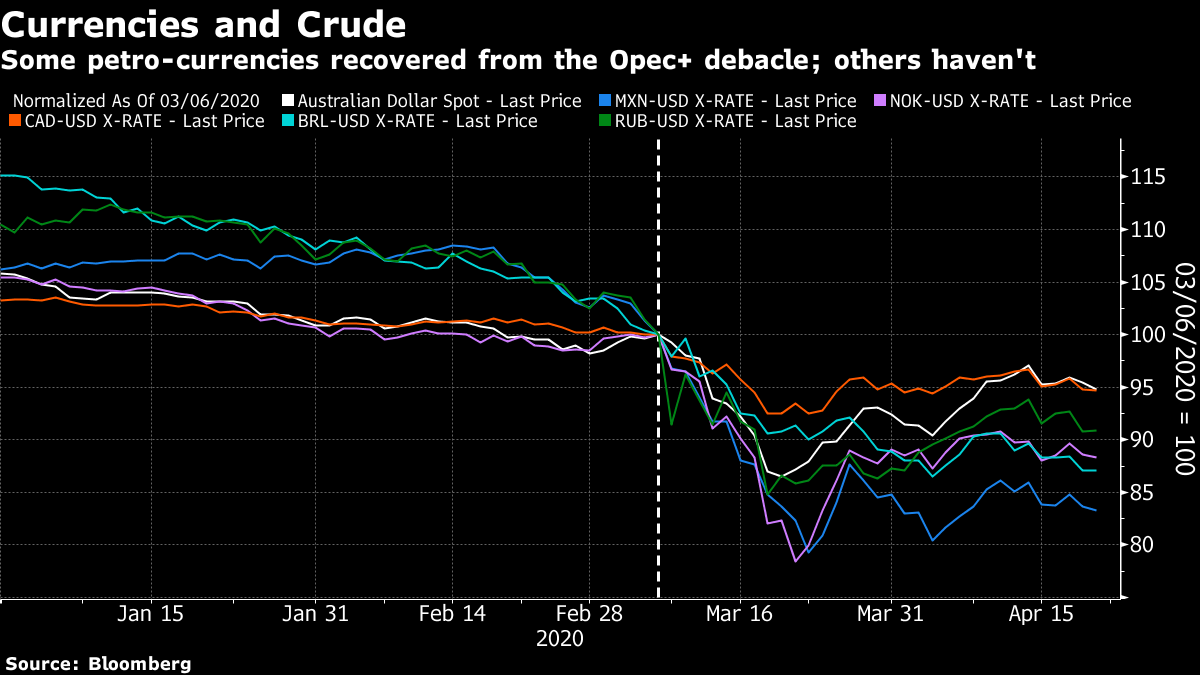
If we have established that these extraordinary events cannot be ignored, however, their effects on other markets are much less than they would once have been. Normally, the greatest single impact of a dive in the oil market would be felt in petroleum-exposed currencies. The following chart, normalized for the weekend when the OPEC+ talks broke down and Saudi Arabia announced increased production, shows that the major petro-currencies sustained a bad hit, led by the Mexican peso and Norwegian krone. Since then most have recovered, with the Mexican peso the most significant laggard — but none were badly buffeted by Monday’s ructions.

Of late, the greatest concern about falling oil prices has been the high-yield market. The U.S. has plenty of heavily leveraged shale producers that will now find it very hard to repay their debts. As this chart from Bloomberg News colleague Sebastian Boyd shows, the energy sector has taken a pummeling in the junk bond market. But other sectors don't seem to have been infected. Hope remains that the Federal Reserve will limit the pain for high-yield bonds:

As for the stock market, energy shares have performed so badly for so long that they no longer have much impact on overall returns. This chart shows the MSCI All-World energy index’s performance, compared to the MSCI All-World excluding fossil fuels index, going back to the indexes’ inception in 2010. Energy stocks have underperformed the rest of the world by about 70%.

Look at the performance over the last year of MSCI’s indexes for the all-world excluding fossil fuels, and its low-carbon target version of the all-world, in which the highest carbon emitters in all sectors are excluded and the remaining stocks reallocated in an attempt to replicate the overall index. Both have performed virtually identically to the overall all-world index since the top of the market in February. At this point, excluding carbon makes little or no difference — and so the knock-on effects for stock markets aren’t very significant:

To put this into glorious perspective, Bespoke Investment Group offers the following chart comparing the current market capitalizations of the four biggest stocks in the S&P 500 (Microsoft Corp., Apple Inc., Amazon.com Inc. and Google parent Alphabet Inc.) with the four smallest sectors. At this point, the entire market value of all the energy and materials companies in the S&P 500 is barely any bigger than Microsoft. All the big four internet stocks are at present bigger, in their own right, than the entire S&P 500 energy sector.

Stocks didn’t have a great day Monday. But a serious decline for the oil industry was already well priced in. For that reason, this extraordinary technical accident had only a mild impact on the broader stock market.
Where does that leave us? It is never safe to ignore an event this extreme and without precedent, particularly when it confirms long-running trends. But other markets were largely well positioned to deal with this, with the possible and significant exception of high-yield credit.
The best bets for the future are that oil will go up from here. (At the time of writing, just before midnight in New York, my terminal tells me that a barrel of oil costs just more than $1; it won’t stay this cheap.) But it is also a good bet that the road to a more sustainable oil industry will be difficult and make the next few months even more hazardous. Without a lot of work, oil prices could easily go negative again.

No comments:
Post a Comment